How to debug JavaScript code?
In this blog post, we will explore and learn different ways to debug javaScript code with examples.
1. Understand how it works #
You can't debug something you don't understand.
If you are given a task to debug a piece of code, the first thing you should do is to understand how the code works and various aspects of it such as whether the code is synchronous or asynchronous, and what is the expected output and so on.
Now, the question is how much do you need to know to debug?
In my opinion, you don't need to know everything about it. But you need to know enough to debug it depending on the syntax and the techniques being used on the code that you are debugging. For example, if you are debugging a piece of code that uses callbacks, you need to know how callbacks work and how to debug them.
The more you debug, the more you will learn and the better you will become at debugging. If you have encountered a similar problem before, you will know how to debug it. If you have not encountered a similar problem before, you will have to learn how to debug it. So, experience is a great teacher.
2. Using console #
It's ok to use
console.log ()oralert ()to debug your code.
console.log () or even alert () can be used to verify whether a given line of code has been executed or not. There is no shame or harm using these simple techniques to debug your code. The console object has tons of useful methods that can be used to debug your code. Some of my favorites are console.log (), console.table (), console.trace (), console.dir () and these work in both browser and node environments.
Code with issue: #
const getPosts = () => {
	let data;
	fetch("https://jsonplaceholder.typicode.com/posts").then((response) => {
		data = response;
	});
	return data;
};
// output is always going to be undefined
console.log(getPosts());
Output
undefined;
Let's add some logs on the console to debug the code #
const getPosts = () => {
	let data;
	fetch("https://jsonplaceholder.typicode.com/posts")
		.then((response) => response.json())
		.then((response) => {
			data = response;
			console.log("Order 1");
		});
	console.log("Order 2");
	return data;
};
getPosts();
Output
Order 2
Order 1
-
When we run the modified
getPosts ()function, we can see that the order of theconsole.log ()is different from the order of the code execution. -
This is because the
fetch ()method is asynchronous and the code wrapped inside thethen ()method is executed only after thefetch ()method is completed successfully.
Now, we have found the issue, so we can fix it by returning the fetch () method inside the getPosts () function. #
const getPosts = () => {
	return fetch("https://jsonplaceholder.typicode.com/posts")
		.then((response) => response.json())
		.then((jsonData) => {
			console.log("Order 1");
			return jsonData;
		});
};
getPosts().then((data) => {
	console.log("Order 2");
	console.log(data);
});
Output
Order 1
Order 2
[{}, {}, ...]
Note: [{}, {}, ...] represent the response from the API call.
We could have used alert () instead of console.log () to debug the code. However, it is only supported in browsers and not in the node environment.
3. Using debugger statement #
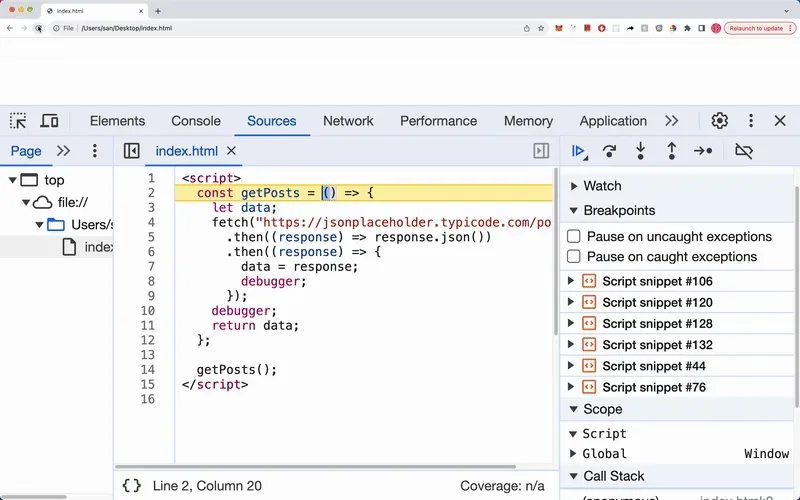
The debugger statement sets a breakpoint in your code in the browser debugger or IDE debugger.
If your environment supports it and is active, execution of the code will pause at the debugger statement and from there you can inspect and do further bug investigation.
This is supported in all major browsers and IDE such as VS Code. Furthermore, it is supported in Node as well.
If we need to debug the code using debugger, we can do it by removing the console.log () statements with debugger statement as follows:
const getPosts = () => {
	let data;
	fetch("https://jsonplaceholder.typicode.com/posts")
		.then((response) => response.json())
		.then((response) => {
			data = response;
			debugger;
		});
	debugger;
	return data;
};
getPosts();
Following is the demonstration of debugger statement usage in the chrome browser.
4. Using browser DevTools or IDE debugging tool #
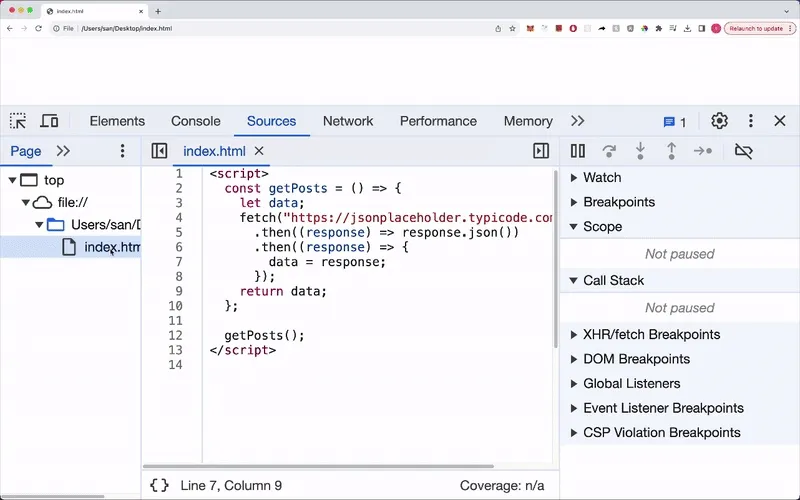
All major browsers have built-in developer tools that can be used to debug your code. For example, the chrome developer tool provides more insights such as call stack, allow to set breakpoints, step through the code, inspect variables, and so on. This is also my favorite method to debug javaScript code.
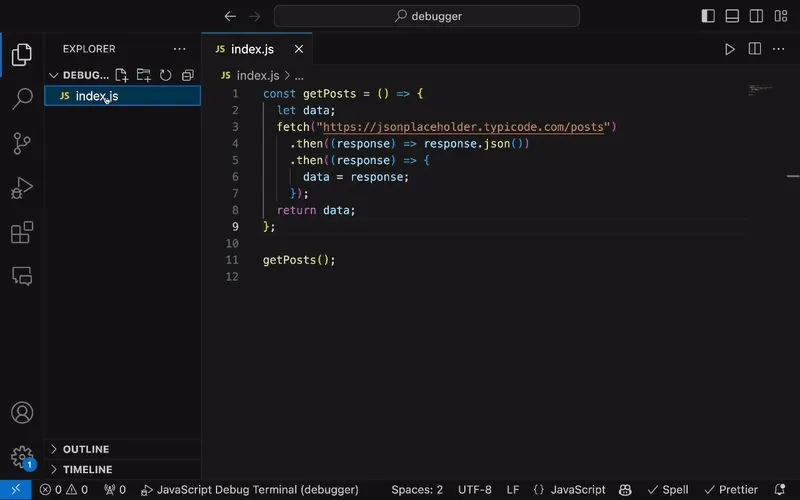
In addition, we can also use IDE debugging tools such as VS Code debugger to debug code. This works very similar to browser DevTools.
Which one should you use? #
| console.log () | debugger |
|---|---|
| Slower since we need to manually open the source code, insert console.log () and reload the page. | Help to find bugs faster by setting breakpoints on relevant lines of code. |
| Requires code change. | No code change required. |
| Explicitly specify each value that needs inspection. | Examine all values at that moment in time without explicitly defining anything. |
5. Modify the code to check if something has changed by seeing the output #
It might sound a bit weird, but it works. Sometimes, if you are not seeing the log or output that you are expecting, you can modify the source code to check if something has changed or not by verifying the output. Modifications include changing the order of the code, removing or adding code, changing the value of the variable and so on.
6. Sending logs to a logging platform #
Sometimes, it is hard to debug code in a local environment using browser DevTools or IDE debugger. In that case, we can send logs to logging platforms such as Grafana and analyze the logs to debug code. This is especially useful when we must debug code in a production environment because of myriads of constraints.
Following is the code excerpt that sends logs to Grafana cloud.
import winston from "winston";
// set up LokiTransport with Grafana cloud
const logger = winston.createLogger(...);

const getPosts = () => {
	let data;
	fetch("https://jsonplaceholder.typicode.com/posts")
		.then((response) => response.json())
		.then((response) => {
			data = response;
			// log with good amount of data
			logger.debug(`1: ${data}`);
		});
	// log with good amount of data
	logger.debug(`2: ${data}`);
	return data;
};

getPosts();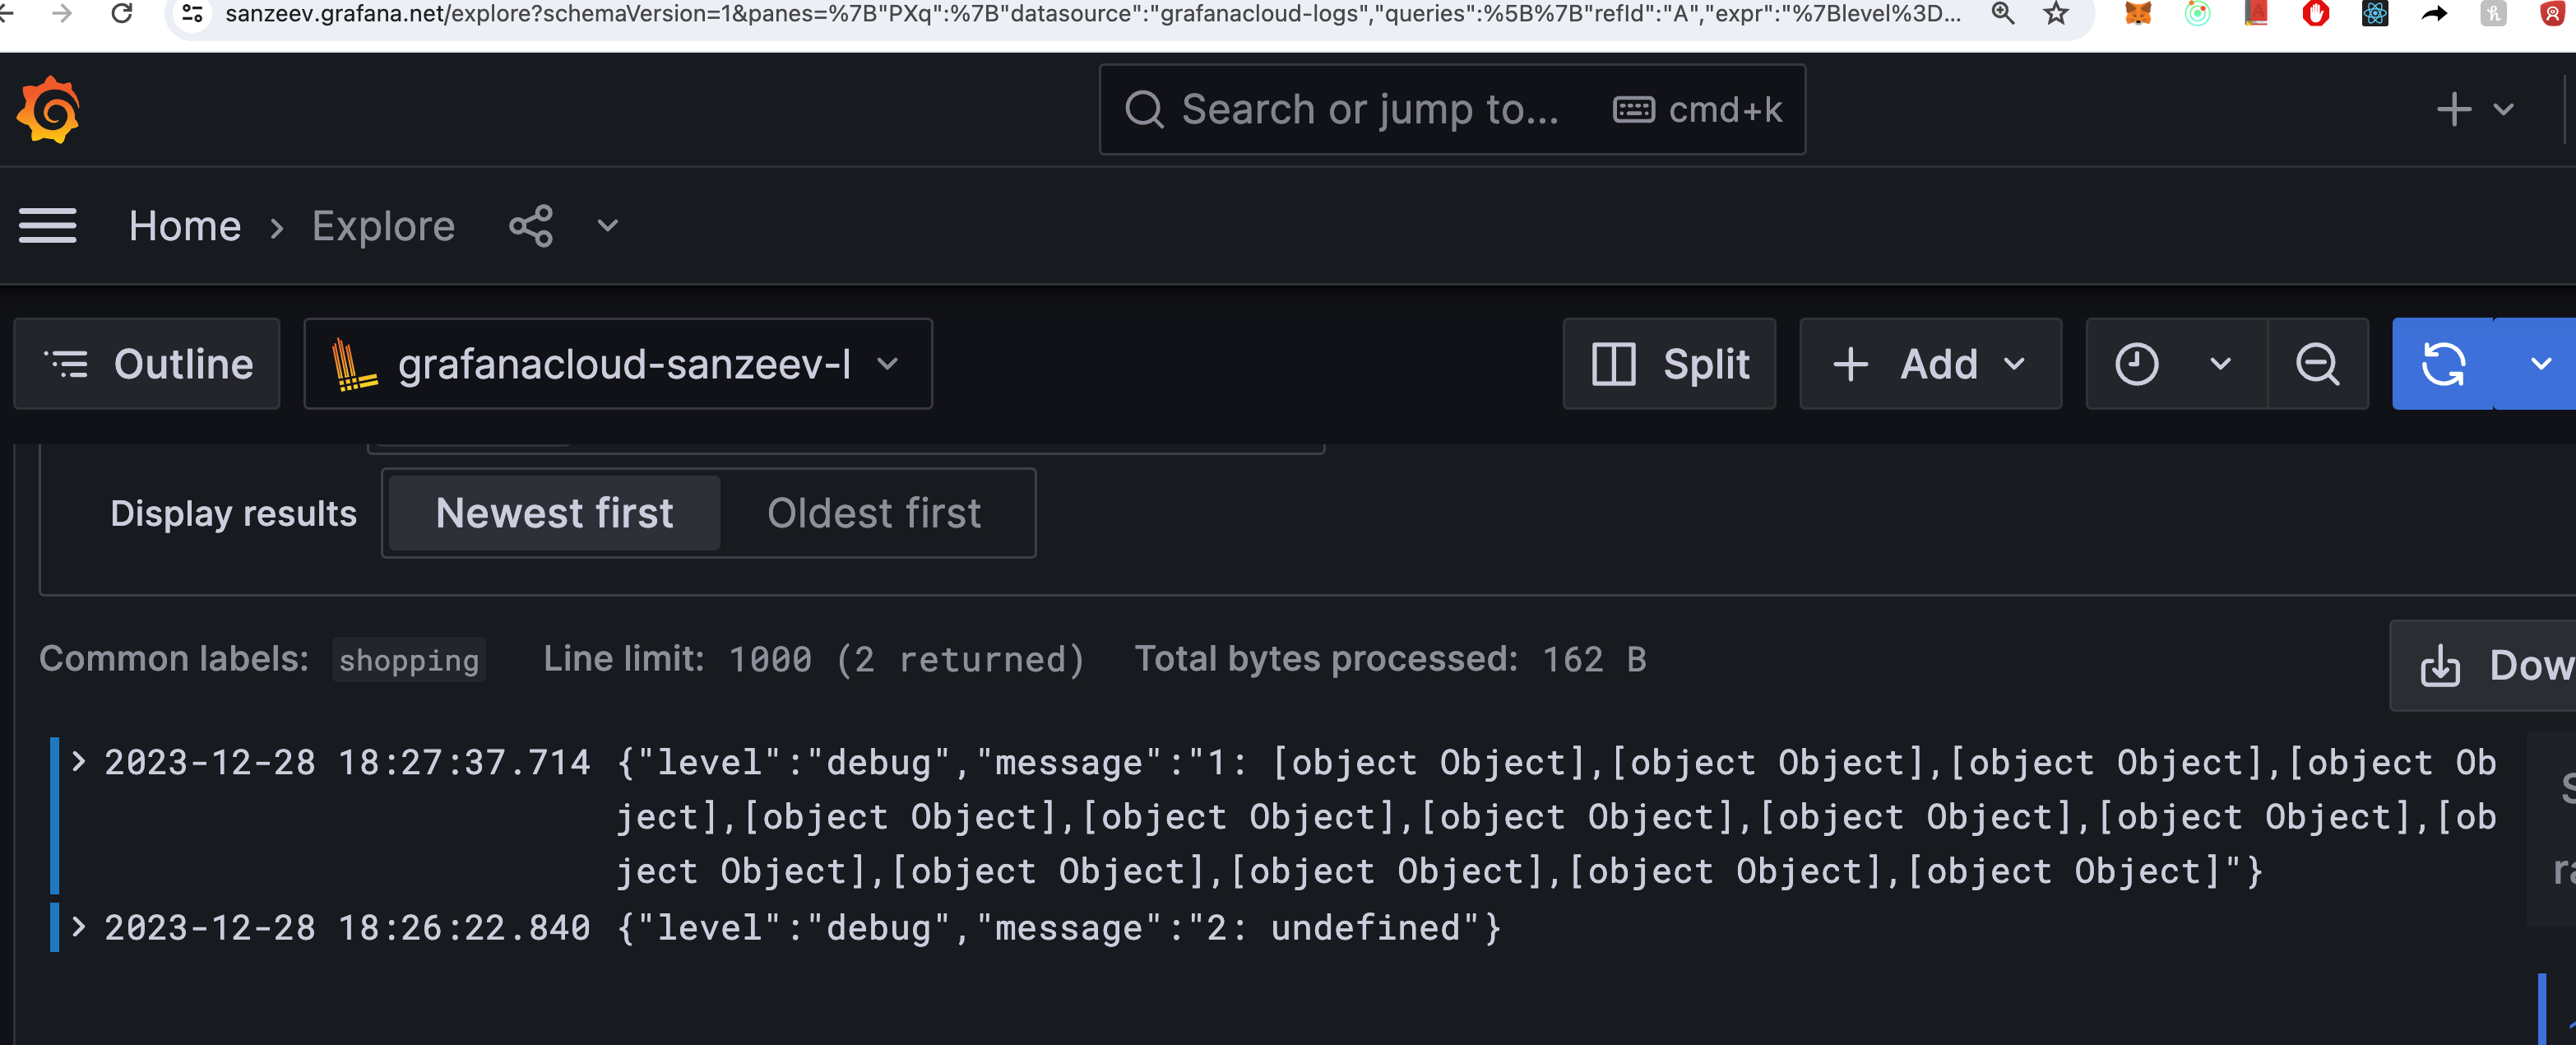
Conclusion #
In this blog post, we have learned different ways to debug javaScript code. I hope you have found this blog post useful. If you have any questions or feedback, please let me know in the comment section below.